STOCK PRICE ANALYTICS: mastering sTOCK INVESTING THROUGH KNOWLEDGE, INSIGHTS, AND INFORMED ANALYSIS
PALANTIR TECHNICAL ANALYSIS & COMMENTARY AS AT 17 JUNE 2025
A Technical Analysis of Palantir (PLTR.NASDAQ) utilizing Technical Analysis Indicators and Technical Analysis Chart Patterns incorporating Two-Timeframe Analysis to forecast probable Price Action over a short-term timeframe on a going-forward basis.
TECHNICAL ANALYSIS
Richard Bennett
7/31/20256 min read
My post content
A. INTRODUCTION TO ANALYSIS & COMMENTARY
One Technical Analysis Chart (TAC) will be presented to illustrate the Technical Analysis Indicators and Technical Analysis Patterns which signal and support the following analysis and commentary of the Price Action and Trend Direction of PALANTIR TECHNOLOGIES INC (PLTR.NASDAQ) as at the Regular Session Market Close of 17 June 2025, as follows:
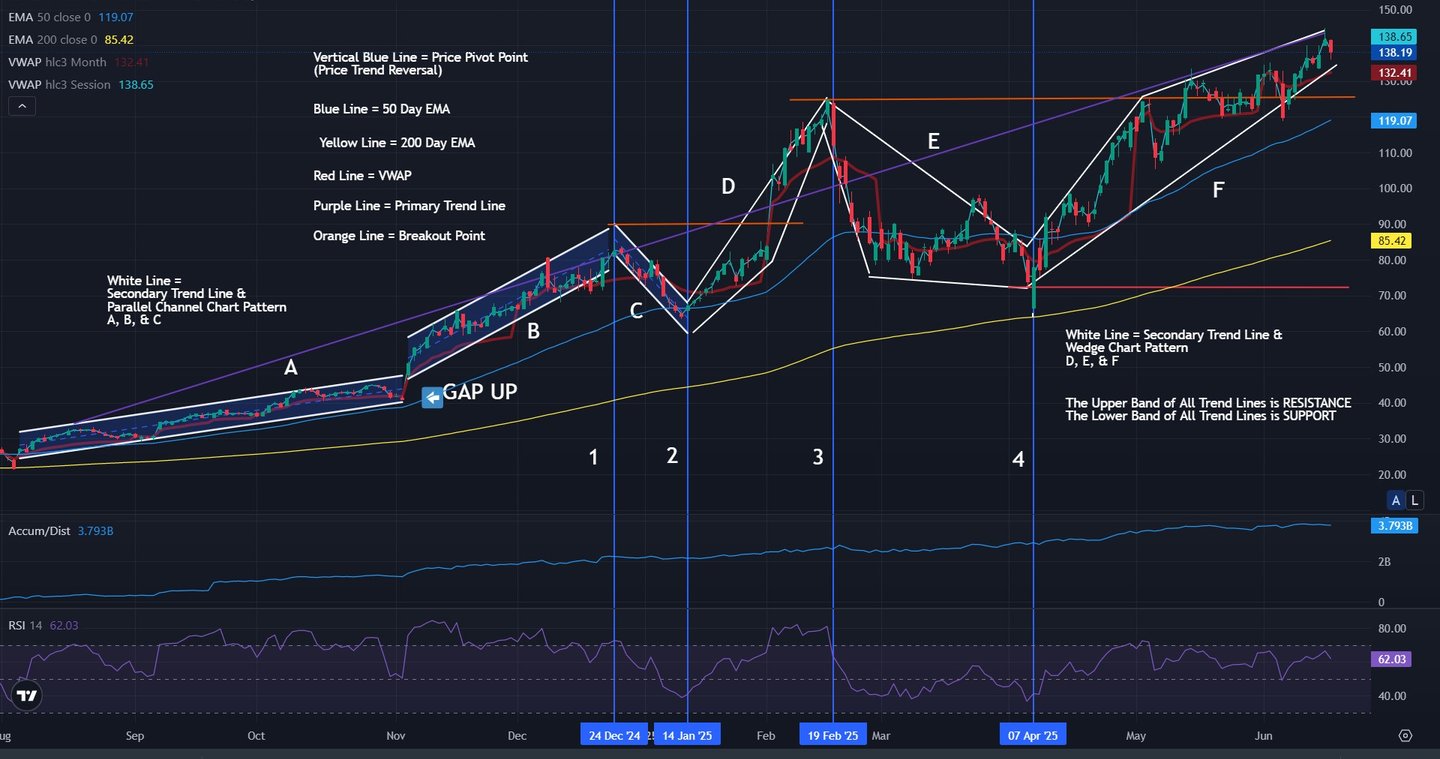
1. The Technical Analysis Chart is a Chart of the SHARE PRICE ACTION of PLTR.NASDAQ from 1 August 2024 to the Close of the Regular Market Trading Session of 17 June 2025 displaying a Japanese Candlestick Chart at One-Day Intervals with the following Technical Analysis Indicators:
a) 50 Day Exponential Moving Average (EMA) – Blue Line on the Chart, which is $119.07. (The 50-Day EMA is the average price of PLTR.NASDAQ over the previous 50 Trading Days).b) 200 Day EMA – Yellow Line on the Chart, which is 85.42. (The 200-Day EMA is the average price of PLTR.NASDAQ over the previous 50 Trading Days).
c) Volume Weighted Average Price (VWAP) – Red Line on the Chart, which is 132.41.
d) Accumulation/Distribution Line (A/D) – Technical Analysis Indicator which is 3.852B.
e) Relative Strength Index (RSI) – Oscillator which is 62.04.
f) An Uptrending Parallel Price Channel Technical Analysis Pattern – Marked as a “A” and “B” on the TAC.
g) A Downtrending Parallel Price Channel Technical Analysis Pattern – Marked as a “C” on the TAC.
h) An Uptrending Ascending Wedge with a Widening Divergence Technical Analysis Chart Pattern which becomes a Narrowing Convergence Technical Analysis Chart Pattern – Marked as a “D” on the TAC.
i) A Downtrending Widening Divergence Wedge Technical Analysis Chart Pattern which becomes a Downtrending Narrowing Convergence Wedge Technical Analysis Chart Pattern – Marked as a “E” on the TAC.
j) An Uptrending Ascending Wedge with a Widening Divergence Technical Analysis Chart Pattern which becomes a Narrowing Convergence Technical Analysis Chart Pattern – Marked as a “F” on the TAC.
k) The 1st “Price Reversal” Point, (also known as a “Pivot Point”) – Blue Vertical Line Marked as a “1” on the TAC.
l) The 2nd “Price Reversal” Point / Pivot Point – Blue Vertical Line Marked as a “2” on the TAC.
m) The 3rd “Price Reversal” Point / Pivot Point – Blue Vertical Line Marked as a “3” on the TAC.
n) The 4th “Price Reversal” Point / Pivot Point – – Blue Vertical Line Marked as a “4” on the TAC.
o) Note the Purple Line on the Price Chart, which is the Primary Trend Line.
p) 1st Breakout Point – Orange UPPER Horizontal Line as shown on the TAC.
q) 2nd Breakout Point – Orange MIDDLE Horizontal Line as shown on the TAC.
r) 3rd Breakout Point – Orange LOWER Horizontal Line as shown on the TAC.
s) Note the GAP UP as shown on the TAC indicated by the Arrow.
The three Technical Analysis Indicators which are used in the Chart are as follows:
· Volume Weighted Average Price (VWAP) – The VWAP Technical Analysis Indicator shows the average Price of a Stock weighted by its trading volume over a specific Timeframe Period”. For this Chart the VWAP Timeframe Period parameter is set to: “HLC3”. This means that the VWAP” Timeframe Period” parameter is set to an INTRADAY SETTING; meaning that the VWAP will RESET at the start of the next trading day’s Regular Trading Session Open.
When Price moves ABOVE the VWAP Line this typically represents a BUY Signal.
Conversely, when Price moves BELOW the VWAP Line this typically represents a SELL Signal.
You should see a correlation between Price and the VWAP Line. When Price is Uptrending, each individual Japanese Candlestick should be ABOVE the VWAP Line. Conversely, when Price is Downtrending, each individual Japanese Candlestick should be BELOW the VWAP Line.
Hence, the VWAP Technical Analysis Indicator is excellent for clearly identifying the Price Trend Direction. Also, the VWAP is excellent for identifying a Stock Entry (Buy) Point and Stock Exit (Sell) Point when Intraday Trading.
· 200 Day Exponential Moving Average (200 Day EMA) – The 200 Day EMA is used to assess long-term Price Trends and potential Support and Resistance levels by calculating the average of the Closing Price of a Stock over the most recent 200 trading sessions by smoothing out price fluctuations and giving more weight to recent data.
· 50 Day Exponential Moving Average (50 Day EMA) – The 50 Day EMA is used to assess long-term Price Trends and potential Support and Resistance levels by calculating the average of the Closing Price of a Stock over the most recent 50 trading sessions by smoothing out price fluctuations and giving more weight to recent data.
The analysis of an Exponential Moving Average over two separate Timeframes enables an easier identification of an existing Trend as well as potential Support and Resistance Levels.
B. CHART ANALYSIS & COMMENTARY
1) Price continued a preceding Uptrend as at the beginning date of the Price Chart, that being: 1 August 2024.
2) The Uptrend continued until 24 December 2024, at the 1st “Price Reversal” Point on the TAC. The Uptrend becomes a Bullish Parallel Channel Technical Analysis Chart Pattern.
3) From 24 December 2024 until 14 January 2025 a Downtrend occurred forming a Bearish Parallel Channel Technical Analysis Chart Pattern Wedge Pattern, which reversed into a Bullish Uptrend on or about 14 January 2025.
4) Price continued its Bullish Uptrend from 14 January 2025 until 19 February 2025. The Uptrend moved initially in an Uptrending Ascending Wedge Pattern which typically indicates more Buyers than Sellers whom are Bidding the Stock Price higher. This is illustrated as a Widening Divergence of the Trend Lines on the Technical Analysis Chart from the beginning of the Uptrend to the midpoint of the Uptrend. Eventually the increasing number of Buyers are exhausted and the Widening Divergence Chart Pattern becomes a Narrowing Convergence Technical Analysis Chart Pattern, which indicates more Sellers than Buyers are trading the Stock. The greater the narrowing of the Convergence of the Trend Lines constitutes a signal of a Potential Trend Reversal.
5) At or about 19 February 2025 a Price Reversal from an Uptrend to a Downtrend occurs, which affirms the narrowing of the Convergence of the preceding Trend Lines which accurately signaled the Trend Reversal which occurred on 19 February 2025.
6) The Downtrend commenced as a steep Downtrend with a Widening Divergence Wedge Technical Analysis Chart Pattern which widened from the top of the Downtrend to the Midpoint of the Downtrend. The Widening from the top of the Downtrend to the Midpoint constitutes more Sellers than Buyers which fuels the Downtrend. At the midpoint of the Downtrend the Widening Divergence Wedge narrows becomes a Downtrending Narrowing Convergence Wedge Technical Analysis Chart Pattern which indicates more Buyers than Sellers. As the Downtrend Wedge Converges into a narrower Channel this is a signal of a Price Reversal from a Downtrend to an Uptrend – shown as “E” on the TAC.
7) All of the Technical Analysis Indicators referenced in sub-parts 1 to 6 above all signal a BULLISH Chart Pattern which is affirmed by the long-term Uptrend which occurred from 17 October 2022 to 19 February 2025.
8) The Downtrend Price Reversal into an Uptrend occurred on 7 April 2025. The Uptrend moved initially in an Uptrending Ascending Wedge Pattern which typically indicates more Buyers than Sellers whom are Bidding the Stock Price higher. This is illustrated as a Widening Divergence of the Trend Lines on the Technical Analysis Chart from the beginning of the Uptrend to the midpoint of the Uptrend. (This is shown as “F” on the Chart).
Eventually the increasing number of Buyers are exhausted and the Widening Divergence Chart Pattern becomes a Narrowing Convergence Technical Analysis Chart Pattern, which indicates more Sellers than Buyers are trading the Stock. The greater the narrowing of the Convergence of the Trend Lines constitutes a signal of a Potential Trend Reversal.
9) The Accumulation/Distribution Technical Analysis Indicator (A/D) Line Indicator is at 181.598 M and continuously trends Upward to the current date, (17 June 2025) with an increasing measurement of Buying over Selling at 3852 B.
The Accumulation/Distribution Technical Analysis Indicator measures the Buying and the Selling Pressure of a Stock by tracking the cumulative flow of Money in a Stock. The Accumulation/ Distribution Technical Analysis Indicator signals whether Traders are accumulating (Buying) a Stock, or distributing (Selling) a Stock.
The Accumulation/Distribution Technical Analysis Indicator signals a Trend Reversal when Price is Ascending and the A/D Line is descending.
When the Accumulation/Distribution Technical Analysis Indicator is Ascending and Price is Ascending and the A/D Line is signaling an Uptrend.
10) The Relative Strength Index (RSI) is at 45.83 on 1 August 2025. On 17 June 2025 the RSI is at 62.03.
An RSI above 50; or Uptrending from 20 and above 50 signals a Buy.
An RSI below 50; or above 80 typically signals a Sell.
11) The Upper Breakout Point, (Price Resistance) of $125.24, has been breeched by on 30 May 2025 for four Trading Days, and again on 6 June 2025, where Price has remained since.
12) The previous Resistance Breakout Point of $90.30 occurred on 4 February 2025.
13) The Lower Breakout Point is Support, which is at $72.66. If Price Breakout below this Price, the Price Trend will typically continue Downward.
14) The Technical Analysis Indicators and the Technical Analysis Chart Patterns referenced herein this Report signal that the OVERALL PRICE and TREND DIRECTION for Palantir is a CONTINUATION OF THE EXISTING UPTREND.
Although the OVERALL PRICE and TREND DIRECTION for Palantir is a CONTINUATION OF THE EXISTING UPTREND, short periods of TREND REVERSALS MAY OCCUR within the Primary Uptrend; (as shown at “C” and “E” on the Price Chart).
© 2025. All rights reserved. Website designed and built by Stock Price Analytics
Get In Touch Today
Contact us for expert Stock Price Analytics Stock and Economic market insights, analysis and commentary tailored for NYSE, NASDAQ, and S&P/TSX Exchange investors and traders.
Connect
1.604.652.1800
inquires@stockpriceanalytics.com