A. INTRODUCTION TO ANALYSIS & COMMENTARY
Three Technical Analysis Charts (TAC) will be presented to illustrate the Technical Analysis Indicators and Technical Analysis Patterns which signal and support the following analysis and commentary of the Price Action and Trend Direction of the S&P 500 Stock Exchange as at the Regular Session Market Close of 6 May 2025, as follows:
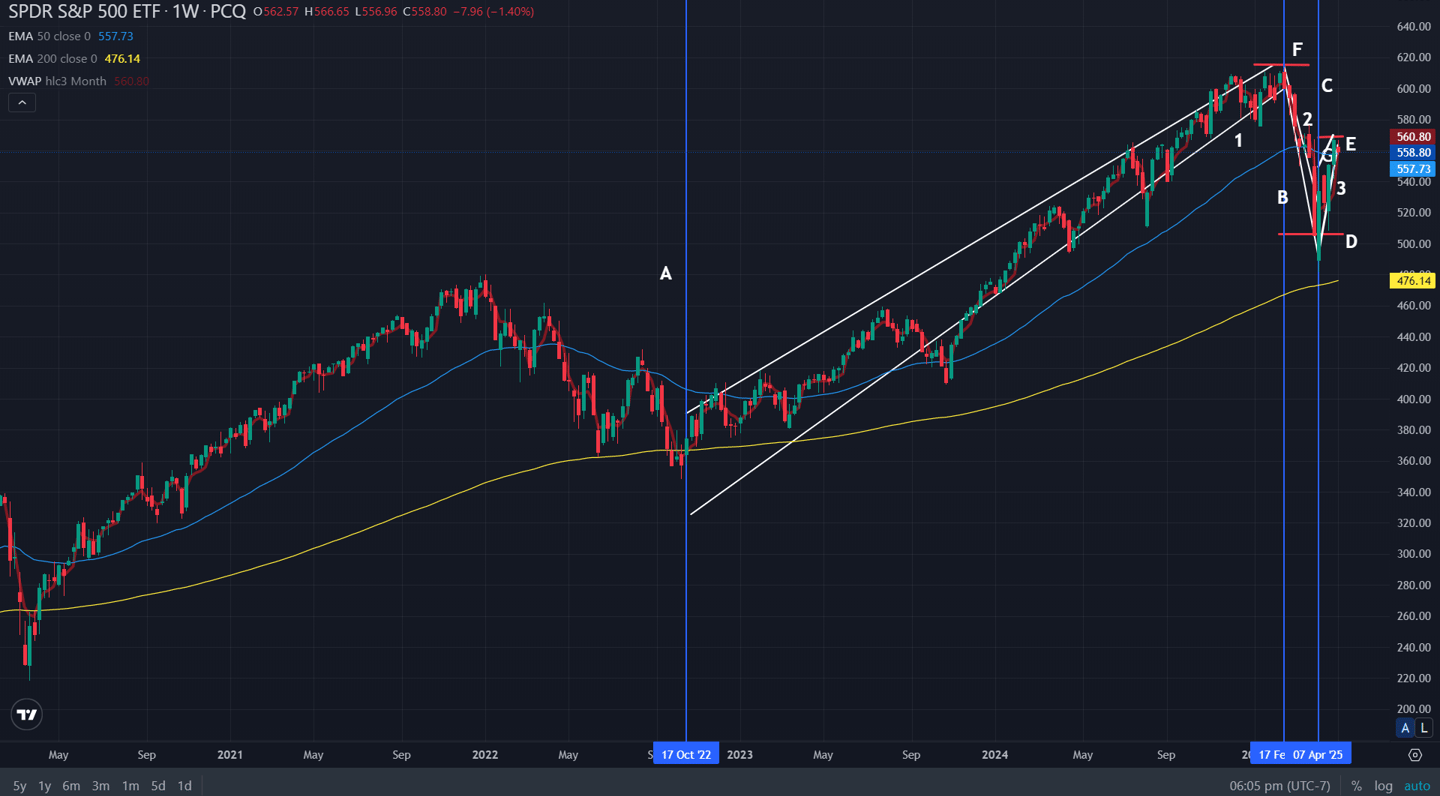
1. Chart 1 is a Chart of the SPY.NASDAQ (Proxy for the S&P 500) 5 Year One-Week Interval Japanese Candlestick Chart with the following Technical Analysis Indicators:
a) 50 Day Exponential Moving Average (EMA) – Blue Line on the Chart, which is 557.92.
b) 200 Day EMA – Yellow Line on the Chart, which is 476.19.
c) Volume Weighted Average Price (VWAP) – Red Line on the Chart, which is 563.72.
d) Accumulation/Distribution Line (A/D) – Technical Analysis Indicator which is 14.477B.
e) Relative Strength Index (RSI) – Oscillator which is 49.07.
f) Uptrending Wedge Price Channel Technical Pattern – Marked as a “1” on the TAC.
g) Downtrending Wedge Price Channel Technical Pattern – Marked as a “2” on the TAC.
h) Uptrending Wedge Price Channel Technical Pattern – Marked as a “3” on the TAC.
i) 1st Price Pivot Point – Blue Vertical Line Marked as a “A” on the TAC.
j) 2nd Price Pivot Point – Blue Vertical Line Marked as a “B” on the TAC.
k) 3rd Price Pivot Point – Blue Vertical Line Marked as a “C” on the TAC.
l) Support Marked at “D” on the TAC.
m) Regular Session Close Marked at “E” on the TAC.
n) Resistance Marked at “F” on the TAC.
2. Chart 2 is a Chart of the SPY.NASDAQ 6 Month Daily Interval Japanese Candlestick Chart with the following Technical Analysis Indicators:
a) 50 Day Exponential Moving Average (EMA) – Blue Line on the Chart, which is 557.92.
b) 200 Day EMA – Yellow Line on the Chart, which is 476.19.
c) Uptrending Wedge Price Channel Technical Pattern – Marked as a “1” on the TAC.
d) Downtrending Wedge Price Channel Technical Pattern – Marked as a “2” on the TAC.
e) Uptrending Wedge Price Channel Technical Pattern – Marked as a “3” on the TAC.
f) 1st Price Pivot Point – Blue Vertical Line Marked as a “A” on the TAC.
g) 2nd Price Pivot Point – Blue Vertical Line Marked as a “B” on the TAC.
h) Support Marked at “D” on the TAC.
i) Regular Session Close Marked at “E” on the TAC.
j) Resistance Marked at “F” on the TAC.
k) Death Cross Marked at “F” on the TAC.
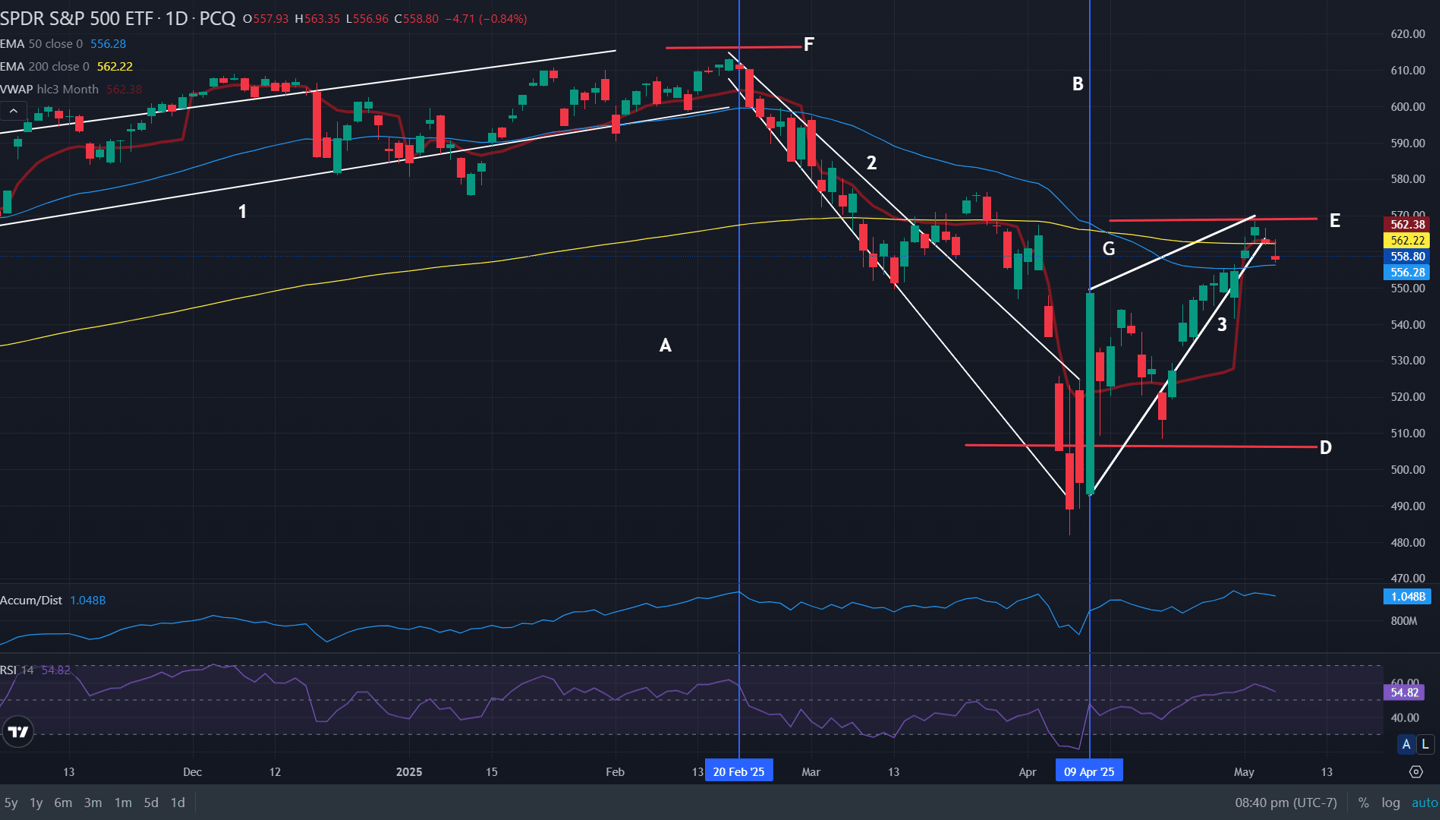
3. Chart 3 is a Chart of the SPY.NASDAQ 6 Month Daily Interval Japanese Candlestick Chart without the following Technical Analysis Indicators that are included in Chart #2:
a) Accumulation/Distribution Line (A/D) – Technical Analysis Indicator which is 14.477B.
b) Relative Strength Index (RSI) – Oscillator which is 49.07.
Without the A/D and the RSI on the Technical Analysis Chart the remainer of the Technical Analysis Indicators can be viewed better by the Chart Reader.
The Technical Analysis Indicators which are used in the three Technical Analysis Charts are to identify PRICE TREND DIRECTION and whether the existing TREND IS IN A CONTINUATION PHASE OR LIKELY TO REVERSE THE EXISTING TREND.
The three Technical Analysis Indicators which are used in the four Charts are as follows:
· Volume Weighted Average Price (VWAP) – The VWAP Technical Analysis Indicator shows the average Price of a Stock weighted by its trading volume over a specific Timeframe Period”. For the four Charts the VWAP Timeframe Period parameter is set to: “HLC3”. This means that the VWAP” Timeframe Period” parameter is set to an INTRADAY SETTING; meaning that the VWAP will RESET at the start of the next trading day’s Regular Trading Session Open.
· 200 Day Exponential Moving Average (200 Day EMA) – The 200 Day EMA is used to assess long-term Price Trends and potential Support and Resistance levels by calculating the average of the Closing Price of a Stock over the most recent 200 trading sessions by smoothing out price fluctuations and giving more weight to recent data.
· 50 Day Exponential Moving Average (50 Day EMA) – The 50 Day EMA is used to assess long-term Price Trends and potential Support and Resistance levels by calculating the average of the Closing Price of a Stock over the most recent 50 trading sessions by smoothing out price fluctuations and giving more weight to recent data.
The analysis of an Exponential Moving Average over two separate Timeframes enables an easier identification of an existing Trend as well as potential Support and Resistance Levels.
B. CHART SYMBOL AND SETUP EXPLANATIONS
Charts #1, #2, and #3 are Charts of the SPY, which is listed on the NYSEARCA Stock Index under the Symbol: SPY.NYSE.
The SPY is an ETF managed by State Street Global Advisors, and is a proxy of the S&P 500 among Investors and Traders. (The SPY is the oldest ETF in the US, launched in January 1993).
Charts #1, and #2 pertains to the Trading Days between 6 March 2020 to 6 March 2025 inclusive displaying Price Action in One-Week intervals.
Chart #3 pertains to pertains to the Trading Days between 6 November 2024 to 6 March 2025 inclusive displaying Price Action in Daily intervals.
C. CHART ANALYSIS & COMMENTARY
1. CHART #1
i) A Downtrend Price Reversal into an Uptrend begins on 17 October 2022.
ii) The Uptrend continues until 19 February 2025. The Uptrend becomes a Bullish Wedge Pattern with a slight convergence from the Base to the Top of the Wedge.
iii) From 1 April 2023 until the completion of the formation of the Bullish Wedge Pattern on 19 February 2025 Price Closes ABOVE BOTH the 50 Day EMA and the 200 Day EMA.
iv) Price Traded ABOVE the 200 Day EMA from 24 October 2022 for the duration of the Uptrend ending on 19 February 2025.
v) The Japanese Candlesticks are BELOW both the 200 Day EMA and the 50 Day EMA, and the VWAP, and continue on the Chart to Downtrend further, as represented by Trendlines #1, #2, #3, and #4, which signals a likely continuation of the Downtrend.
vi) The SPREAD between the 50 Day EMA and the 200 Day EMA widens between 17 October 2022 to 19 February 2025.
vii) All of the Technical Analysis Indicators referenced in sub-parts 1 to 6 above all signal a BULLISH Chart Pattern which is affirmed by the long-term Uptrend which occurred from 17 October 2022 to 19 February 2025.
viii) The convergence of the Uptrending Wedge Marked as “1” on the Chart which becomes narrower commencing at 21 October 2024 signals fewer Buyers than Sellers and Signals a POTENTIAL Trend Reversal to the Downside could occur within a short-term timeframe.
ix) A BULLISH Price Reversal into a BEARISH Downtrend does occur and begins on 20 February 2025.
2. CHART’S #2 AND #3
Chart 3 is the same Chart as Chart #2 but without the following Technical Analysis Indicators that are included in Chart #2:
a) Accumulation/Distribution Line (A/D) – Technical Analysis Indicator which is 14.477B.
b) Relative Strength Index (RSI) – Oscillator which is 49.07.
Without the A/D and the RSI on the Technical Analysis Chart #3 the remainder of the Technical Analysis Indicators can be viewed better by the Chart Reader.
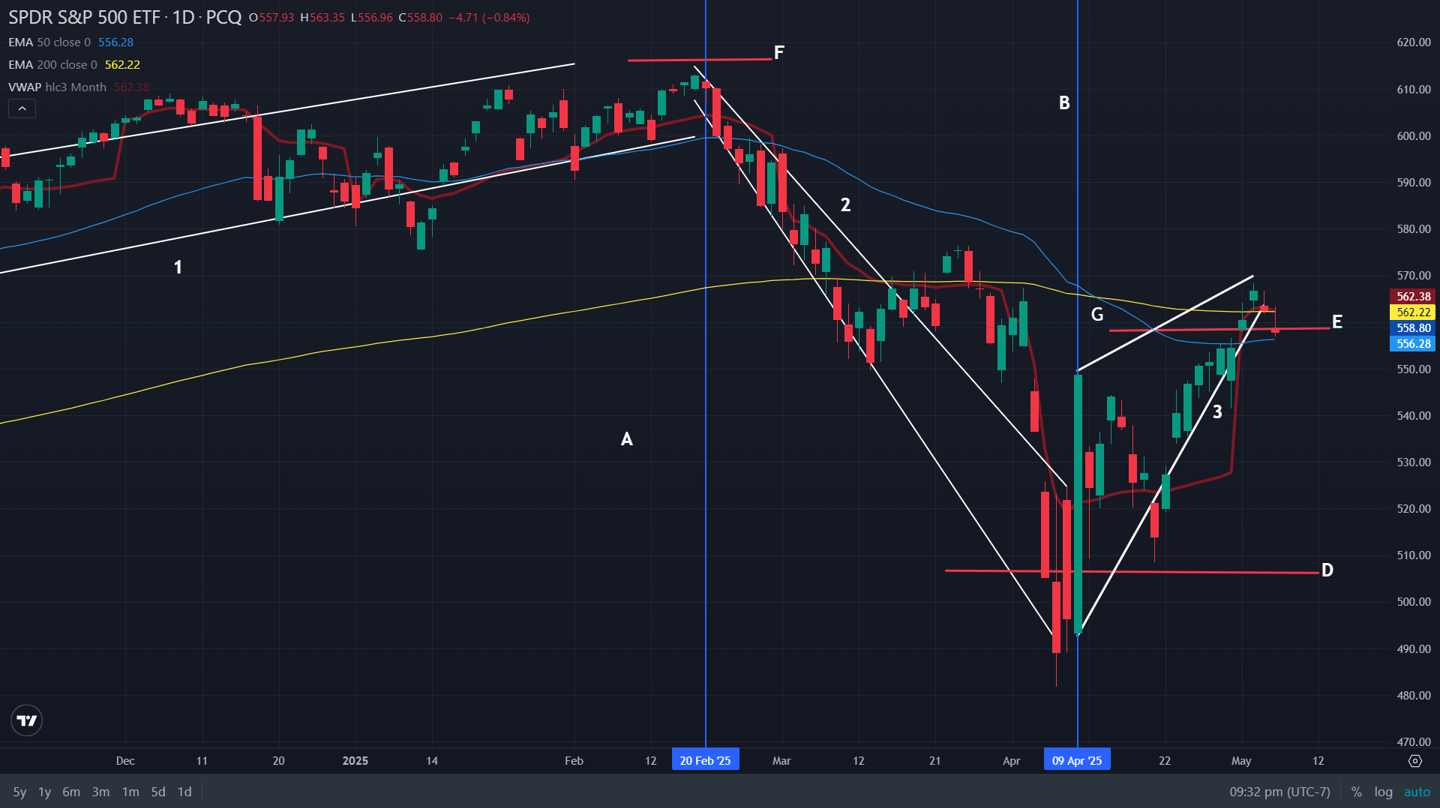
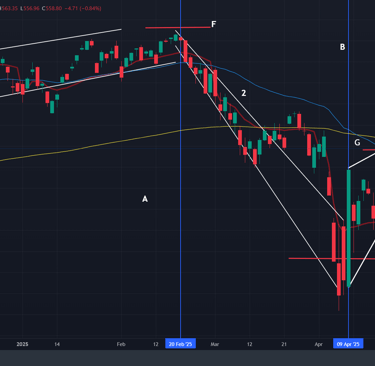
i. A Downtrend begins on 20 February 2025.
ii. A BEARISH WEDGE Pattern which is shown as “2” on the Chart is sloping DOWNWARDS; which is what confirms the Wedge is BEARISH in nature.
iii. The Bearish Wedge becomes WIDER at its Base indicating more Buyers than Sellers and Signals a POTENTIAL Trend Reversal to the Upside could occur within a short-term timeframe.
iv. As at 25 February 2025 the Japanese Candlesticks are BELOW both the 50 Day EMA, and close predominantly below the VWAP, and continue on the Chart to Downtrend further, until the conclusion of the Downtrend on 9 April 2025.
v. A Price Pivot Point occurs on 10 April 2025 when a Downtrend Reversal to the Upside occurs.
vi. A short Bullish Uptrend occurs between 10 April 2025 to the Regular Session Close on 2 May 2025.
vii. The A/D Line Indicator commences a Decline on 30 April 2025 and continues to the Regular Session Close on 6 May 2025 which signals a declining number of Buyers; and also signals a POTENTIAL Trend Reversal to the Downside could occur within a short-term timeframe.
viii. The A/D Line Indicator commences a Decline on 30 April 2025 while Price continued to Uptrend and Close with a Positive Gain for 3 days; afterwhich Price closed Negative over the following two Trading Days thereafter to the Regular Session Close on 6 May 2025.
A declining A/D Line Indicator while Price continues to Uptrend constitutes a DIVERGENCE, and signals a POTENTIAL Trend Reversal to the Downside could occur within a short-term timeframe.
ix. The RSI commences a Decline on 2 May 2025 and continues to the Regular Session Close on 6 May 2025 which signals a BEARISH TREND.
The RSI at the Regular Session Close on 6 May 2025 was 54.82
x. A DEATH CROSS occurs on 10 April 2025. (On Chart #2, a Death Cross is when a 50 Day EMA crosses below the 200 Day EMA). A Death Cross is a BEARISH Technical Analysis Chart Pattern.
xi. Support is Marked at “D” and is 506.24.
xii. Regular Session Close Marked at “E” and is 558.80.
xiii. Resistance Marked at “F” and is 616.40.
xiv. The narrowing of the Uptrending (Bullish) Wedge, (which is a Converging Wedge Pattern), at the Top signals that a POTENTIAL Trend Reversal to the Downside could occur within a short-term timeframe.
xv. Price Closed the Regular Session on 6 May 2025 at 558.80; which is minus 57.60 Points from Resistance (at 616.40), and plus 52.56 Points from Support (at 506.24).
If a Bullish Reversal to the Downside occurs and a BREAKOUT occurs BELOW the existing Support level at 506.24, then Price is likely to Downtrend further below 506.24.
xvi. Alternately, if the existing Converging Wedge Pattern continues its previous Uptrend, the Converging Wedge would become a Parallel Bullish Price Channel. If Price BREAKOUTS about the existing Support level at 616.40, then Price is likely to Uptrend further above 616.40.
D. S&P 500 FORECAST
Given the following considerations:
i. An A/D Indicator that is Declining.
ii. An RSI that is Declining and at 54.82.
iii. A Converging Bullish Wedge which indicates fewer Buyers.
iv. A Death Cross of the 50-Day EMA crossing below the 200-Day EMA.
v. Trump 2.0 Tariff Policies uncertainty and unresolved Trade Agreements between the US and other Sovereign States.
vi. Trump 2.0 Tariff Policies and an unresolved Trade Agreement between the US and China.
vii. Higher cost for Goods to the US Consumer resulting from Trump 2.0 Tariff Policies ensuing in lower Disposable Consumer Income; reduced Consumer Spending; reduced Corporate Revenue and Profit.
viii. Lower forecast US GDP on a quarter over quarter going forward basis.
ix. US Recession in the second half of 2025 is forecast by leading US Market Analyst’s including Moody’s Analytics[1]; JP Morgan[2]; Apollo Global Management[3]; and CNBC CFO Council Survey[4].
x. Reduced Consumer Confidence and reduced Corporate Sentiment due to the preceding considerations referenced above, in sub-parts 5 through 9 inclusive.
All of the preceding factors cited Part D herein constitute HEADWINDS for the S&P 500 that Stock Price Analytics opines Market Participants have NOT FULLY Priced in to the S&P 500 over a short-term timeframe of 12 months.
Consequently, over a short-term time frame Stock Price Analytics opines the S&P 500 will likely DECLINE from its current level of 5,606.91 (the S&P 500 Regular Session Close as at 6 May 2025), notwithstanding the following factors that will mitigate a DECLINE and DRAWDOWN of the S&P 500 from 5,606. These mitigating factors are:
i. A Lower Policy Interest Rate.
ii. A proposed reduction of the Corporate Tax Rate from 21% to 15%.
iii. A proposed reduction of the Individual Tax Rate from 21% to 15%.
The reduction of Corporate and Individual tax Rates in the US is far from certain, notwithstanding that Republican lawmakers plan on passing proposed tax legislation using the Reconciliation Process, which only requires a simple majority in the House of Representatives and the Senate.
However, the Republican Party only holds a slim majority in the House of Representatives of three votes; which constitutes the smallest House majority since 1931.
Consequently, potential holdouts of the proposed tax legislation have a lot of leverage.
Deficit Hawks may oppose specific tax proposals that will result in a increase of the Federal Debt without a corresponding “Offset”.
Centrist Members may oppose the elimination of existing tax incentives that would constitute an “Offset” if the elimination of the tax incentive results in harm to any industry in their District.
E. ACKNOWLEDGEMENTS & ADDITIONAL INFORMATION
Technical Analysis Charting Platform (ADVANCED DASHBOARD) provided by:
TD Direct Investing, a Division of TD Bank (The Toronto Dominion Bank)
66 Wellington Street West
Toronto, ON
M5K 1A2.
1.800.465.5463
Email: tdir@td.com.
For more information for Canadian Clients about the TD Direct Investing ADVANCED DASHBOARD go to:
Information on the various TD Direct Investing Trading Platforms: https://www.td.com/ca/en/investing/direct-investing/trading
For more information for US Clients about an equivalent Trading Platform to TD Direct Investing ADVANCED DASHBOARD; which is THINKORSWIM, go to:
Charles Schwab & Co., Inc.
3000 Schwab Way
Westlake, TX 76262,
888.245.6864
Specific information on THINKORSWIM and various Schwab Investing Trading Platforms:
https://www.schwab.com/trading/thinkorswim/desktop
[1] From Business Insider, 4 May 2025, at: https://www.businessinsider.com/recession-2025-outlook-what-3-bearish-forecasters-think-will-happen-2025-5?token=eyJhbGciOiJIUzI1NiIsInR5cCI6IkpXVCJ9.eyJmaXJzdF9uYW1lIjoiUmljaGFyZCIsImxhc3RfbmFtZSI6IkJlbm5ldHQiLCJtZW1iZXJfaWQiOiI3YzhhYmFkMC1mNWFlLTQ1NWItYmMwMy1kZGMwZmU2MWRjMTciLCJlbWFpbCI6InJuZGJlbm5ldHQxQGdtYWlsLmNvbSIsInN1YiI6IjdjOGFiYWQwLWY1YWUtNDU1Yi1iYzAzLWRkYzBmZTYxZGMxNyIsImlhdCI6MTc0NjYzNjk3NSwiZXhwIjoxNzU0NDEyOTc1LCJhdWQiOiJCNnNJWEtMaWluIiwiaXNzIjoiaHR0cHM6Ly93d3cuYnVzaW5lc3NpbnNpZGVyLmNvbSIsImp0aSI6ImZlNTkyNmRkLWI1MzgtNDFhMi05Y2M5LWY2ZDEyZWIzNjgyNCJ9.1l-n3QkWothFVhCgLs7irrZj2oSKGRXPlGpSgcC3FTg&accountCreated=true&type=social
[2] J.P. Morgan, 15 April 2025, at: https://www.jpmorgan.com/insights/global-research/economy/recession-probability
[3] Ibid, Business Insider, 4 May 2025.
[4] From CNBC – The Bottom Line, 25 March 2025, at: https://www.cnbc.com/2025/03/25/recession-is-coming-pessimistic-corporate-cfos-say-cnbc-survey.html